This confidential analysis is issued by Fisher Investments Australasia Pty Ltd ABN 86 159 670 667 AFSL 433312 (“FIA”) and is only available to wholesale clients as defined under the Corporations Act 2001. It is not an investment recommendation. Although it is based on data provided to FIA that is assumed to be reliable, the accuracy of the data cannot be guaranteed. Investments involve risks. Past performance is no guarantee of future returns nor a reliable indicator of current and future returns. Neither FIA, nor any other person, guarantees the investment performance, earnings or return of capital of your investment. Opinions expressed in this analysis are current only at the time of its issue. We may change our views at any time based on new information, analysis or reconsideration. Forward looking statements are based on current expectations, assumptions and beliefs and involve risks and uncertainties. All these factors may cause actual outcomes to be materially different. To the maximum extent permitted by law, neither FIA nor its directors, employees or agents accept any liability for any loss arising from reliance on this analysis. FIA is wholly-owned by Fisher Asset Management, LLC trading as Fisher Investments (FI). Fisher Investments is an investment adviser registered with the Securities and Exchange Commission. FI and its subsidiaries serve a global client base of diverse investors.
Fisher Investments (FI) is an investment adviser registered with the Securities and Exchange Commission. As of 30 June 2021, FI managed $187 billion, including assets sub-managed for its wholly-owned subsidiaries. FI and its subsidiaries maintain four principal business units - Fisher Investments Institutional Group (FIIG), Fisher Investments Private Client Group (FIPCG), Fisher Investments International (PCGI), and Fisher Investments 401(k) Solutions Group (401(k) Solutions). These groups serve a global client base of diverse investors including corporations, public and multi-employer pension funds, foundations and endowments, insurance companies, healthcare organisations, governments and high-net-worth individuals. FI’s Investment Policy Committee (IPC) is responsible for investment decisions for all investment strategies.
The information in this document constitutes the general views of Fisher Investments and its subsidiaries and should not be regarded as personalized investment advice or a reflection of the performance of Fisher Investments or its clients. We provide our general comments to you based on information we believe to be reliable. There can be no assurances that we will continue to hold this view; and we may change our views at any time based on new information, analysis or reconsideration. Some of the information we have produced for you may have been obtained from a third party source that is not affiliated with Fisher Investments. Investments in securities involves the risk of loss. Past performance is no guarantee of future returns. The above information is presented in US dollars, unless otherwise noted. Currency fluctuations between the US dollar and the Australian dollar may result in higher or lower investment returns.
-
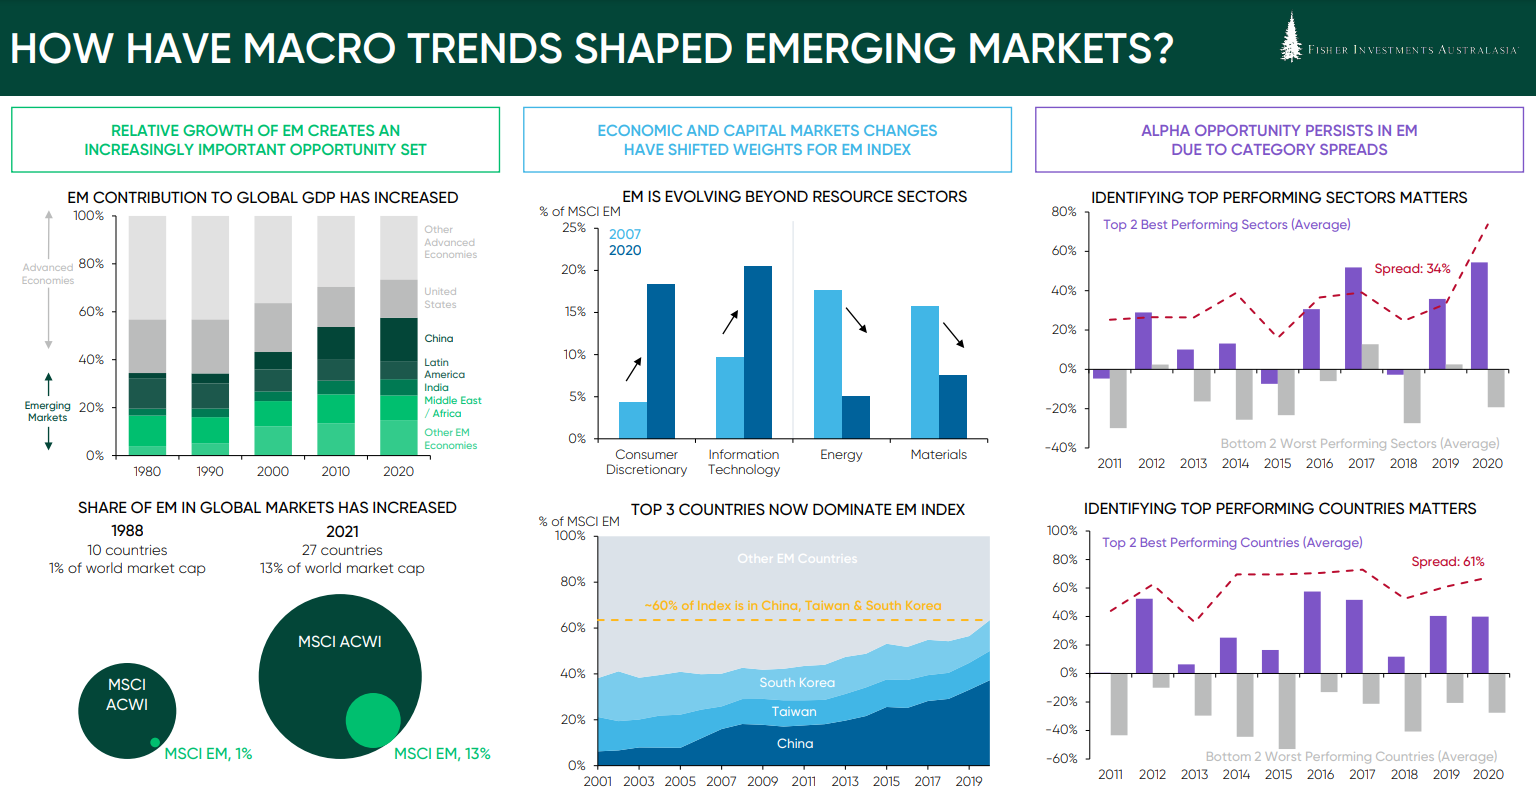
Top Left Source: IMF, as of December 2020.
-
Bottom Left Source: FactSet & MSCI, as of June 2021. MSCI Emerging Markets Index was introduced in 1988. Data shows market cap of MSCI Emerging Markets Index as a percentage of MSCI All Country World Index.
-
Top Center Source: FactSet, as of December 2020. Data shows change in relevant sector weight within the MSCI Emerging Markets Index between 2007 and 2020.
-
Bottom Center Source: FactSet, as of December 2020.
-
Right Source: FactSet, as of December 2020. The data set for a given year is the MSCI Emerging Markets Index constituent list for each year end, and the returns used are price returns. “Top 2 Best Performing Sectors Average” takes the arithmetic average of the top two performing countries in the MSCI Emerging Markets Index for a given year. The same concept is applied for “Bottom 2 Worst Performing Sectors Average.” The “Average Sector Spread” is the arithmetic average of the yearly spread between “Top 2 Best Performing Sectors Average” and “Bottom 2 Worst Performing Sectors Average.” The same methodology is applied for “Bottom 2 Best Performing Countries Average” and “Bottom 2 Worst Performing Countries Average.”